Place names are a form of shared understanding, and of shared definition. Last week saw some discussions at the University of Cyprus’s Archaeological Research Unit on the technical and conceptual approaches that our Heritage Gazetteer of Cyprus (finded by the A. G. Leventis Foundation) will take; and how it will attempt to express such shared understandings of place on the island. In this process, we hope to shed new light on its history and archaeology. This post sets out the current state of our thinking, which will surely evolve further over the coming weeks and months, and will – we hope – form the synopsis of a longer and more formal and detailed article, which will be submitted for publication in due course.
There can be few places in the world where this matters more. The island of Cyprus has occupied a place of immense strategic importance since the time of its earliest occupation, where, for example, there is direct evidence of trading links between Cyprus and New Kingdom Egypt (C16th BC), to the present day. The island sits, as it always has, at (and indeed as) the crossroads between Europe, the Middle East and Africa. Our gazetteer therefore seeks to represent structure, without privileging one interpretation over another. In our world, the fact that an authority has attested the existence of a place name in a particular form is sufficient to be considered for inclusion. We do not make a value judgement on the extent of the authority or the provenance of the name. In the longer term an Editorial Board will be formed to consider such matters, but in the framework we are establishing, we are concentrating on expressing the relationship between forms, rather than peer-reviewing them. In this, with so many other projects in this field, we draw inspiration from the Pleiades gazetteer and Pelagios project as means of defining and sharing ancient geography, although in this project we are not constrained to the Classical world to quite the extent that previous efforts has been. As will become clear, this makes matters considerably more complex.
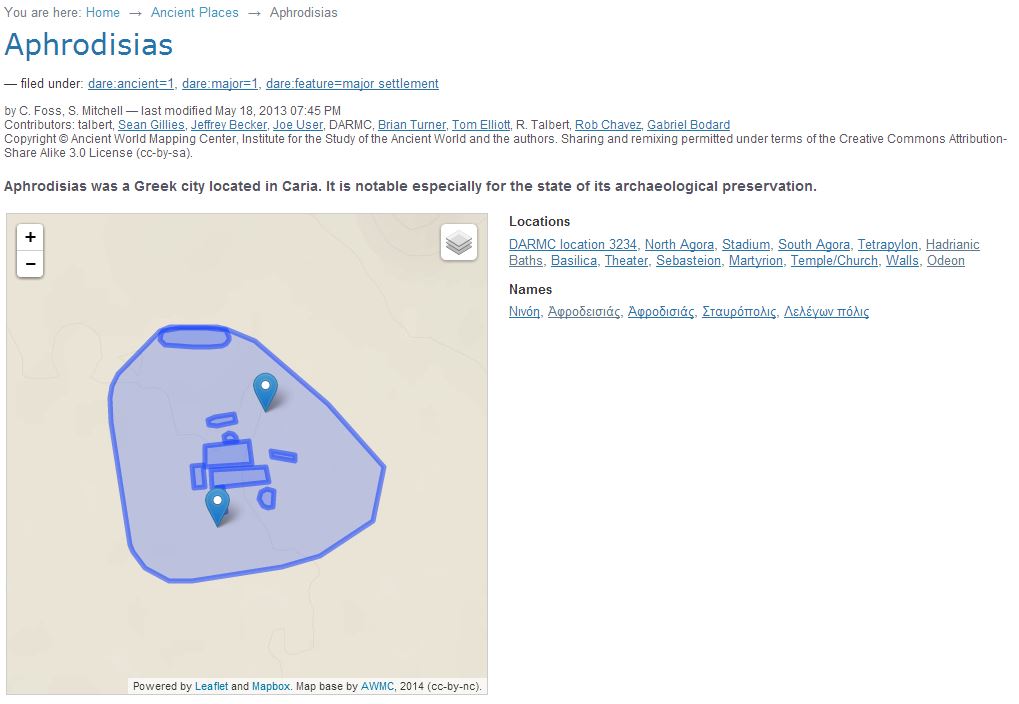
We begin with a tripartite structure, beginning with modern place name and administrative unit. These will be derived from the Complete Gazetteer of Cyprus, an authoritative statement of the state of Cypriot geography as of 1983. These will be represented by a consistent URI string, www.cyprusgazetteer.org/[CGCid (please note none of these URIs are currently operational), where CGC represents a unique value derived from the CGC itself. We are currently in discussions with the University of Cyprus’s Library on linking up with existing digitization work here, so exactly what form the gazetteer references to the CGC will take remain to be determined. However, we know that the administrative district (and its spatial footprint) is an attribute of such a location. Beneath this, we introduce a layer of Historic Units. These represent sites which are larger than individual monuments or findspots, which have some form of toponymic identity in their own right, and these can contain smaller units. The URI string for these will be www.cyprusgazetteer.org/CGCid/HUid. Examples might include Old Nicosia (which would be associated upwards with the modern name of Nicosia, Λευκωσία, and whatever CGC-derived URI we end up using). This feature term will also include settlements such a monasteries, and also cemeteries and archaeological excavations. As well as a georeference – likely to be a pologyon – expressing the HU’s spatial footprint, much as the Pleiades project does for sites where this is an issue, such as Aphrodisias:
We will also include a reference here to the heritage taxonomies being developed by the Department of Antiquities’ Cyprus Archaeological Digitization programme – with whom we hope to collaborate closely in the coming months. This will not only aid the searchability of Historic Units, it will also ensure that we are coordinating with local expertise on the ground.
Prehistoric sites represent a further challenge. Frequently, but not always, the name form given to a prehistoric site in the literature (where it is attested) is that of the nearest modern settlement. Therefore, in such cases, we will populate the HU section of the URI with a null value, so that while the name will be conceptually on the level below the highest CGC-derived modern form, and be distinct from it (including having its own separate georeference/spatial footprint) it will still share that form. However this will also avoid providing a false positive, by forcing a link with a Historic Unit where so such link exists. Each form will also have a date, or a date range, illustrating when it was in use, when it was attested as being in use, and the date of the document providing that attestation. In all cases we will seek to provide the earliest form of the date.
Our lowest level will be an Archaeological Entity record, comprising the URI string www.cyprusgazetteer.org/[CGCid]/[HUid_or_Null if not applicable]/AEid]. This will also have a georeference, either a point or a footprint, and a CADiP reference. The naming attribution for the forms and attestations will work in much the same way as for the Historical Units, and they will be similarly dated, both by attestation and documentation.
A new element in our project is that the community will be invited to add names to Units and Entities, as long as each name is accompanied by a verifiable reference, and a date or date range. Users will be able to add unlimited forms (the way a name is spelled). One example might be the Church of St Nicholas of the Roof, which might also be represented as ‘St. Nikolaus of the Roof’, or Άγιος Νικόλαος της Στέγης’. These are differing forms, but they may or may not be attested in the same source.
The complexities can be illustrated by the case of Hala Sultan Tekke:

In contemporary times this name refers to the small but extremely important mosque on Larnaca Salt Lake, according to Islamic tradition the final resting place of the Prophet’s foster mother and one of Islam’s holiest sites. However, Hala Sultan Tekke is also a major site of the Late Bronze Age, with an urban settlement a few hundred meters to the west of the mosque.

In our structure, the mosque would be represented as an Archaeological Entity, with the name forms Hala Sultan Tekke, and Mosque of Umm Haram, etc. This will stem from the same URI, with extensions for the two names. The Bronze Age site will have a separate URI, with a null value inserted to show it does not belong to a named Historic Unit. Both URIs will contain the GCG-derived unique identifier for Dromolaxia, which is attributed to the Larnaca district.
This project addresses a question of fundamental importance in the Digital Humanities, and indeed in digital history and archaeology: how can place and location be expressed as narratives in the contemporary world around us? How can digital mapping and geodata be deployed in such a way that deals sensitively with contemporary views of place and history, and how can the stories that these two things tell when they come together be told? Our Gazetteer is beginning to show us what the building blocks of those narratives might look like. We welcome discussion from any and all who are interested in this, in Cyprus or anywhere else.